Introduction: Fortune 500 Companies R
Overview
The purpose of this introductory notebook is to get our feet wet with R, starting off with a simple, but certainly not boring, dataset. We will be using the Fortune 500 companies list from 1955-2005.
We’ll do some simple plotting with ggplot to explore the data in greater detail and addressing issues with the data as we find them.
Imports
library(tidyverse)
library(DT)
Tidyverse is the bread and butter of many R-based analyses, it provides us with ggplot, pipe operators (%>%), spreading, dataframe manipulations, and much, much more.
Data
The external data used in this notebook can be obtained from: https://www.dataquest.io/blog/large_files/fortune500.csv
The CSV file contains information about fortune 500 companies spanning the years 1955 - 2005.
There are 25500 rows representing 51 (years) sets of 500 (companies).
The provided columns include:
Year- year that the fortune 500 list was publishedRank- company’s position on the fortune 500 listCompany- name of the companyRevenue (in millions)- company’s revenue for that yearProfit (in millions)- company’s profit for that year
f500 <- read.csv('data/fortune500.csv')
# f500 <- datatable(f500,
#          #extensions = c('FixedColumns',"FixedHeader"),
#           options = list(scrollX = TRUE,
#                          paging=TRUE,
#                          fixedHeader=FALSE))
# #(f500 <- read.csv('data/fortune500.csv'))
head(f500, n=20)
# Remove the trailing peroid from column names
colnames(f500) <- gsub('\\.$','',colnames(f500))Exploratory Data Analysis
The dataset has a handful of missing values which we will need to deal with and some interesting duplicates that may or may not be data errors.
all(complete.cases(f500))## [1] TRUEstr(f500)## 'data.frame': 25500 obs. of 5 variables:
## $ Year : int 1955 1955 1955 1955 1955 1955 1955 1955 1955 1955 ...
## $ Rank : int 1 2 3 4 5 6 7 8 9 10 ...
## $ Company : Factor w/ 1887 levels "3Com","3M","A-T-O",..: 724 618 1727 718 607 369 145 787 1171 561 ...
## $ Revenue..in.millions: num 9824 5661 3250 2959 2511 ...
## $ Profit..in.millions : Factor w/ 6977 levels "-0.1","-0.2",..: 6486 5688 2940 3143 2864 2733 1341 2774 2787 4313 ...The complete cases statement here is telling us that there is no missing values, however, something is amiss in the Profit..in.millions field. It was read in as a factor rather than a double, a strong indication that some other value may be used as a stand-in for N/A
summary(f500$Profit..in.millions)## N.A. 4 3 5.7 6 3.1 2.6 5 7
## 369 73 71 67 67 66 65 65 65
## 3.7 4.1 4.7 3.4 3.6 4.8 6.1 4.3 6.6
## 64 64 64 63 62 62 62 60 60
## 2.8 4.2 6.2 2.4 3.5 9.4 2.7 4.9 5.4
## 59 59 59 58 58 58 56 56 56
## 5.8 9.6 2.2 5.5 6.5 5.1 1.9 3.3 3.8
## 56 56 55 55 55 54 53 53 53
## 4.6 8 4.4 5.2 6.9 7.3 10.1 2.5 3.2
## 53 53 52 52 52 52 51 51 51
## 5.6 7.4 12.1 6.3 6.4 8.1 8.4 2.9 7.1
## 51 51 50 50 50 50 50 49 49
## 7.2 9 4.5 7.8 10.2 11.1 3.9 7.7 7.9
## 49 49 48 48 47 47 47 47 47
## 2 2.3 5.9 10.4 22.1 6.7 7.6 8.2 1.4
## 46 46 46 45 45 45 45 45 44
## 1.8 10.8 11.3 8.9 13.1 14 15.2 7.5 8.3
## 44 44 44 44 43 43 43 43 43
## 8.7 1.3 10.7 5.3 13 19 9.1 1 1.7
## 43 42 42 42 41 41 41 40 40
## 14.1 15 8.8 9.5 1.1 1.2 12.4 9.2 1.6
## 40 40 40 40 39 39 39 39 38
## (Other)
## 20152The string N.A. is likely the root of this issue
f500 %>% filter(Profit..in.millions == 'N.A.')f500$Profit..in.millions <- as.double(gsub('N\\.A\\.',0.0,f500$Profit..in.millions))Here, we can use gsub again to replace all the N.A. values with 0.0, casting it to a double
sum(table(f500$Company) > 50)## [1] 74There are 74 companies who have been included all 51 years
head(f500 %>% count(Company, sort=TRUE), n=20)It appears that CBS and OfficeMax, have duplicate entries in certain years, let’s see if we can track down the erroneous years.
f500 %>%
  filter(Company %in% c("CBS", "OfficeMax")) %>%
  group_by(Year, Company) %>%
  count() %>%
  filter(n > 1)
CBS is duplicated in years 1972-81, 1995 and OfficeMax is duplicated between 1996-2003. Since we only can assume that this is an error and cannot know for sure without understanding the data collection process, we will leave these entries be for now. It is also possible that these duplication are due to a merger between companies in later years, given that all company names are represented by their 2005 equivalent.
Plotting exploration
f500 %>%
filter(Company %in% c('Kellogg','3M','Pfizer')) %>% # Choose 3 arbitrary companies
ggplot(mapping = aes(Year, Rank, color=Company)) +
geom_line(aes(linetype=Company), size=1.2) +
labs(title='Fortune 500 Rank - 3M, Kellogg, and Pfizer (1955-2005)') +
scale_y_continuous(breaks = seq(0, 300, by=30), limits=c(300,1), trans = 'reverse') +
geom_vline(xintercept = 1994)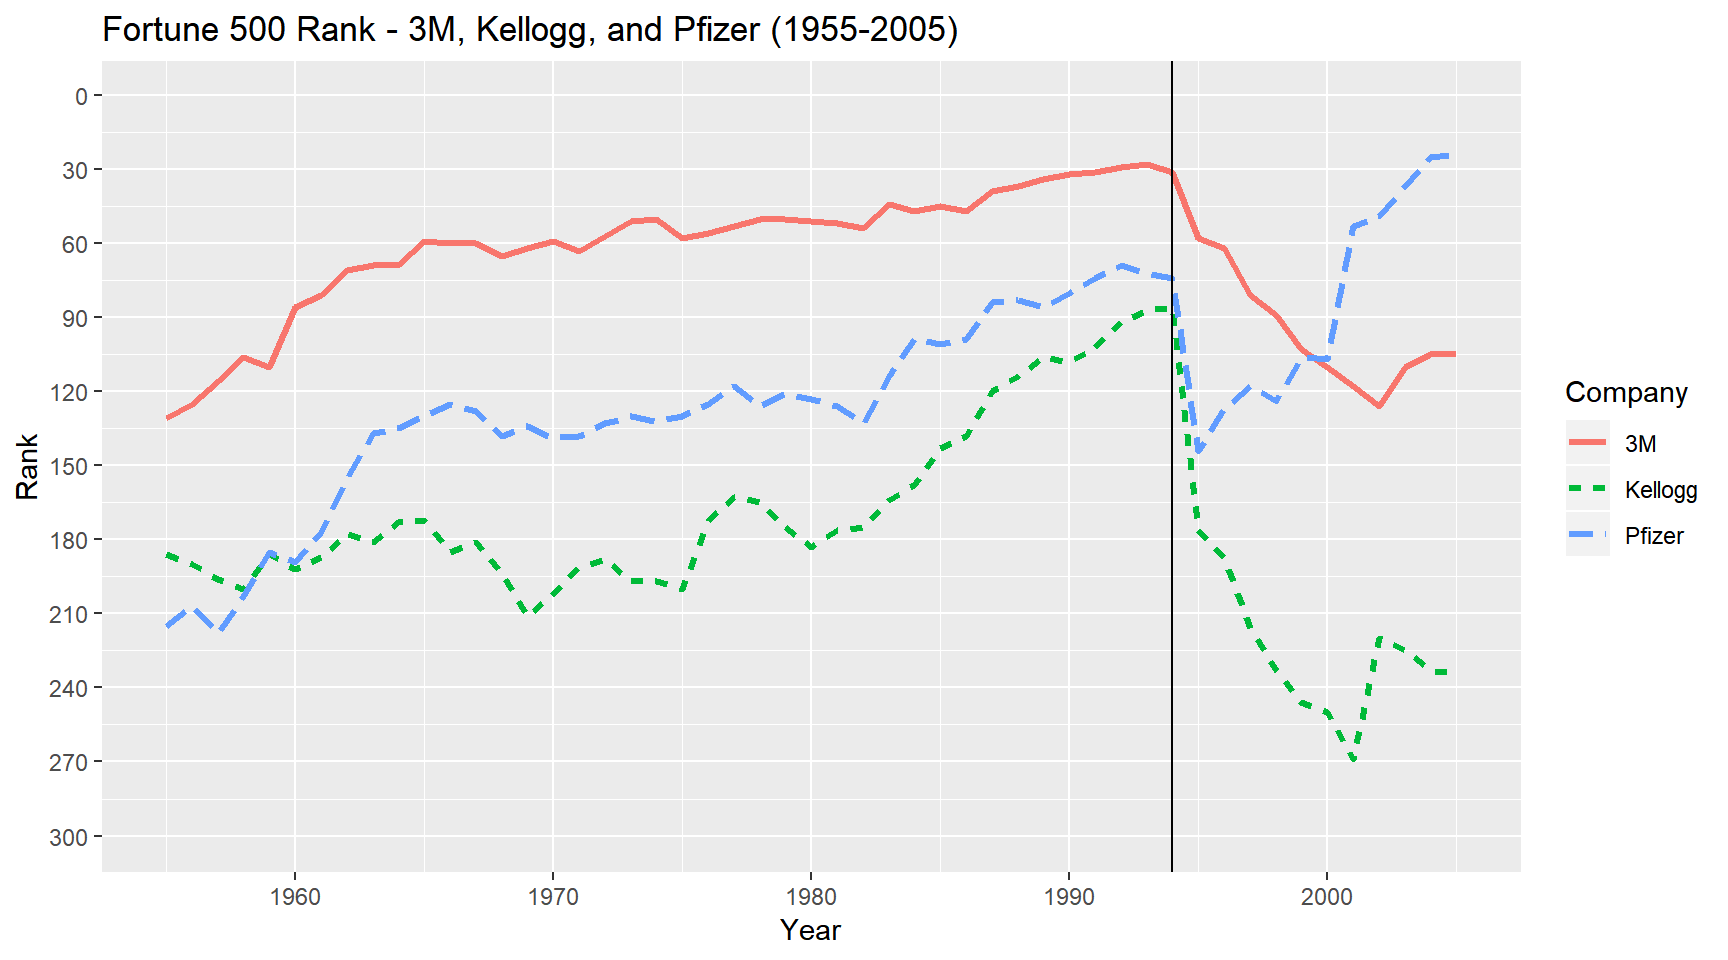 Clearly, in 1994 there was a large upset in these particular company’s historical trends. In absence of other information, one may guess that the proliferation of the internet may be at play in these sharp declines.
head(sprdf <-f500 %>%
  filter(Year %in% 1993:1996) %>%
  select(c(Year,Company,Rank)) %>%
  spread(Year, Company), n=30)
We can already spot a quite few changes in the top 10 ranks between ’94 and ’95. Only 1 company changed between ’93 and ’94 but just one year later we see 3 new companies as well as many shifts up and down the ladder.
length(setdiff(sprdf$`1994`,sprdf$`1995`))## [1] 291length(setdiff(sprdf$`1993`,sprdf$`1994`))## [1] 33Comparing all entries between 1994 and 1995 yields a set-wise difference of 291 companies, compare that to the previous year pair and we only see a total difference of 33 companies. Let’s see if this spike is abnormal compared to all other sequential pairs.
f55.99 <- f500 %>%
  filter(Year %in% 1955:1999) %>%
  select(c(Year,Company,Rank)) %>%
  spread(Year, Company)
Note: years 2000-2005 refused to spread nicely due to duplicate value entries, so they were omitted. From the python analysis, we know that this range fits expectations regardless
yoy.diff <- vector()
for(i in 2:45) yoy.diff <- c(yoy.diff, length(setdiff(f55.99[,i],f55.99[,i+1])))
yoy <- data.frame(cbind(Year=as.numeric(colnames(f55.99[3:46])),diff.from.prev = as.numeric(yoy.diff)))
yoy %>%
ggplot(aes(Year, diff.from.prev)) +
geom_line() + geom_point() +
labs(title="Number of differing companies compared to previous year") +
scale_x_continuous(breaks = seq(1955,2000,5)) +
scale_y_continuous(breaks = seq(0,300,50))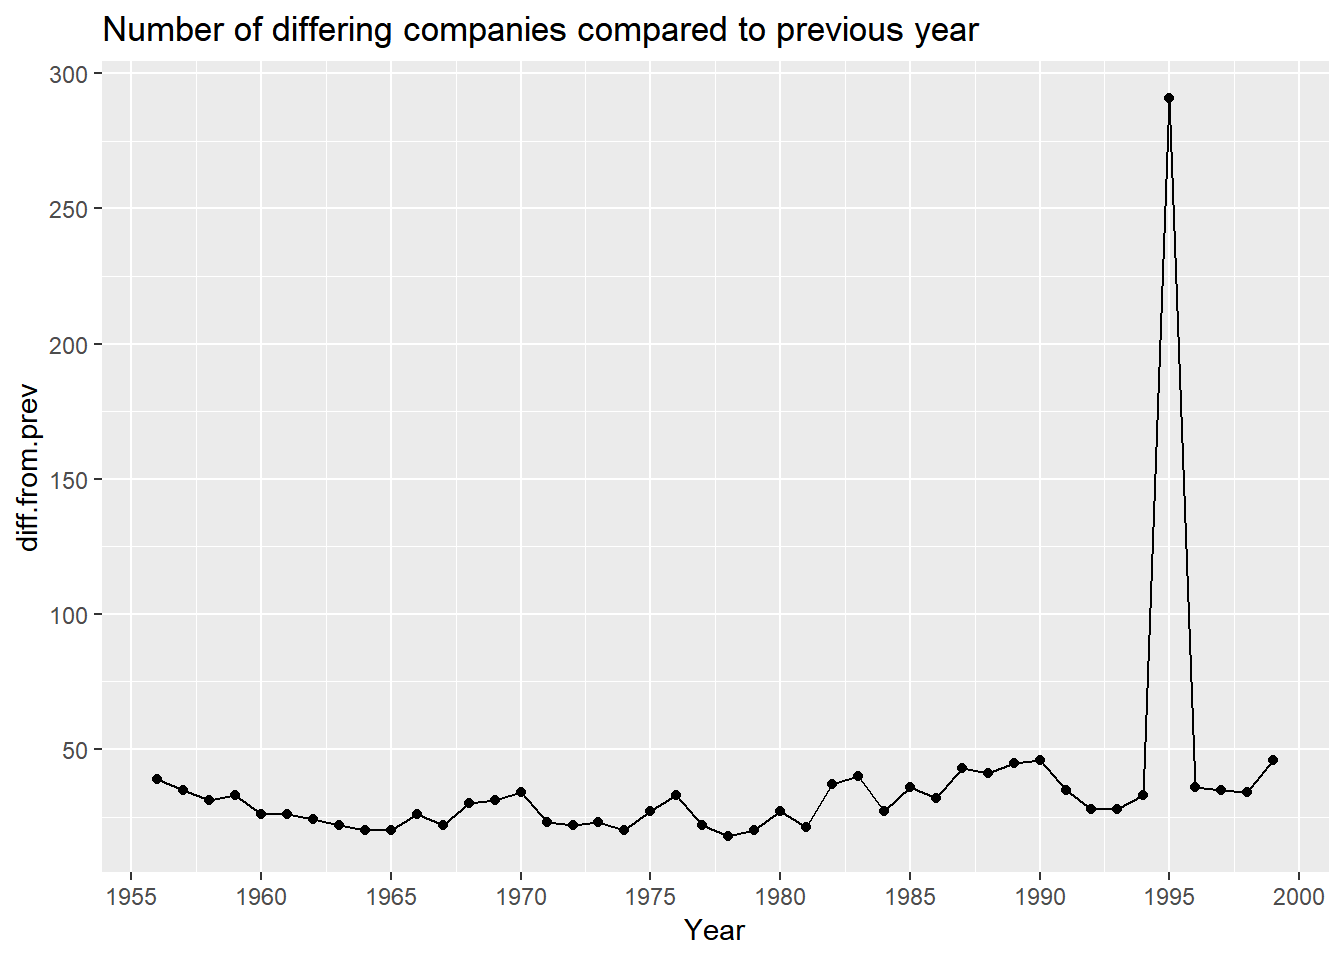 A plot showing year over year difference verifies that 1994-1995 was indeed an anomaly. Our previous hypothesis that the sudden shift was due to the internet proliferating is almost certainly incorrect. The far more likely scenario is that there is either an error in the data collection process, or, the Fortune 500 list dramatically changed their company selection process.
Conclusions
This notebook took a brief look at the Fortune 500 companies dataset (1955-2005). Our analysis led to several interesting discoveries, namely, we found that CBS and OfficeMax are included twice in certain years, and from 1994 to 1995 there was a dramatic shift in included companies. Despite the chosen dataset being relatively simple, we still managed to extract some useful information out of it. We did not even use the revenue or profits columns, so there is still a lot of room for exploration.
Future Work
We leave this notebook with some unanswered questions:
- What actually caused the ’94-95 shift?
- Why were some companies included multiple times?
A fully fleshed out analysis would seek external sources of information and bring it into the notebook to answer these questions. Additionally, we could certainly investigate profits and revenue to see how they correlate with ranking from year to year, or even do some simple linear modeling to really start to understand this data. These sort of analyses and many others will be performed in following notebooks, so have a look around if you’d like to dig a little deeper.